This month is a view into the state of plant automation control (also known as batch panel) consistency and accuracy for a sample of seven producers located in North America for the period of May 2024 through April 2025.
The data shows a baseline analysis of batching accuracy of COMMANDbatch systems in use. The data is analyzed for load sizes of 6 yards and up (net of any reshipped concrete), as this is the largest percentage of loads for any producer and where the biggest loss or gains can be found. From a combined 107 plants, these producers shipped 427,883 loads of concrete with an average load size of 9.5 yards.
Why This Is Important
As raw material costs comprise between 40-60% per cubic yard/m3, batching accuracy is important. Producers instinctively know that accurate material batching saves money and is the primary component affecting concrete production quality in our industry. However, there is little information about how the industry performs in general. This blog provides analysis from a cross section of industry producers to allow the entire industry to measure itself against this reality and, most importantly, find ways to improve profitability by knowing if there is an opportunity to improve an operation.
About The Data
The information provided is based on data from Command Alkon’s COMMANDbatch system and collected by Willaman Solution’s REDI-VIEW analytics platform.
Specifics about the data include:
- Batching accuracy information was accumulated on the last batch when multi-batches were required.
- The accuracy totals are accumulated based on whether they are an aggregate or cementitious material.
- There is no distinction made between coarse and fine aggregates, nor for cementitious versus cementitious substitutes.
The accuracy data is accumulated using four independent metrics for each material group: [1]
| Name | Description | Potential financial impact |
| ∑ Over Target (Tn) | This is the total amount of material (tons) over the original material target amount, whether in tolerance or not. | This is the most impactful number. Every pound of material that is over the target is a potential saving. |
| ∑ Over Allowed Tolerance (Tn) | This is the total amount of material (tons) that was over the specified material tolerance. | This is the most identifiable number. Every pound of material that is over the allowed tolerance is wasted dollars. Knowing the cost of overweighing may justify action to improve the plant operation. |
| ∑ Under Target (Tn) | This is the total amount of material (tons) under the original material target amount, whether in tolerance or not. | This is a very unappreciated number. Every pound of material that is under the target is saving money. If quality and yield are not overly impacted, this is the ‘sweet spot’. |
| ∑ Under Allowed Tolerance (Tn) | This is the total amount of material (tons) that was under the specified material tolerance. | This is the most dangerous number. Every pound of material that is under the allowed tolerance can have a serious impact on concrete quality. |
Batching Accuracy Results
This next table describes the year-long results of the COMMANDbatch systems in use.
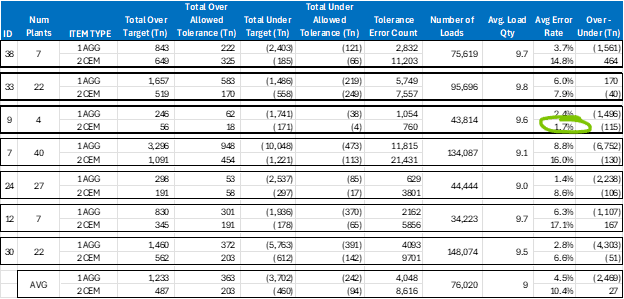
There are some interesting statistics in this table. For example, the range of batching inaccuracy events varies from a low of 1.7% of loads to a high of 17.1% for cementitious materials. How is one producer able to keep their cementitious material accuracy so high, while the rest of the industry struggles with rates many times that? The consistency of aggregate materials ensures inaccuracy events occur much less frequently; that said, the difference in events between the best performer and the worst performer is over 600%.
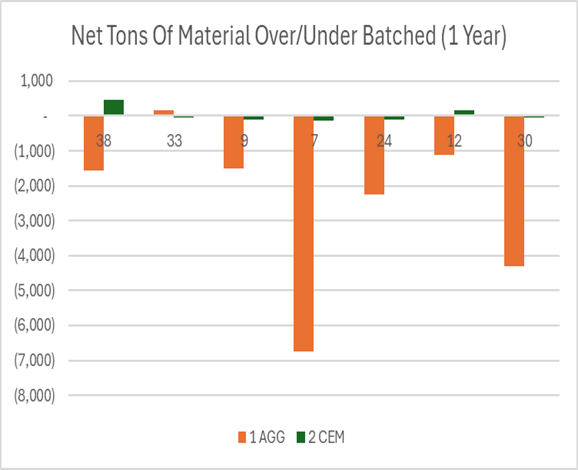
The other, perhaps surprising statistic, but no doubt understood by the CFOs, is the financial benefit of under batching material. The last column of the table [Over – Under (Tn)] shows, in most cases, over the long term, under batching material events, more than compensate for over batching material events. We all know this because if we look at production reports, they are usually well within the allowable tolerances.
That is certainly not true all the time: the first line of the table shows the producer shipped 649 tons of ‘over batched’ cementitious materials for the period under review. In that same period, they safely (within 1% tolerance) ‘under batched’ 185 tons, leaving a net of 484 tons of technically unnecessary cementitious materials. They also have a high out of tolerance event rate, which is a sign for production management to investigate…$70,000+ of annual cement savings should cover some improvements to the plants.
About the Data
Putting a dollar value on this is inexact, as these numbers are the result of blending materials at different rates in different mix designs. The data is available to separate cement from fly ash, or sand from lightweight, but that is not the point of the data. The state of concrete production quality in our industry still has much room for improvement, but that improvement is double-edged… the more accurate our plants produce concrete the better the consistency and customer results will be. But the industry has also financially benefited from those plant automation systems that provide consistent under target (but within specification) material quantities. If systems are asked to be more accurate, i.e., get closer to the target when underweight, total material costs will increase.
[1] In the event of a tolerance error, the COMMANDbatch system provides the operator with a choice to adjust/modify the material quantity before accepting. These numbers are accumulated after that decision has been made.
As a key architect behind COMMANDbatch and REDI-VIEW, Randy Willaman brings decades of hands-on experience with concrete batching systems. Through his posts, Randy shares his unparalleled expertise and insights with concrete producers looking to maximize their system’s potential. Learn more about his services and REDI-VIEW at willamansolutions.com.